Apple has speed and stamina

  • 16 February 2012 |
  • Written by  Skot Kortje, Stock Trends Analyst
  • font size
  • Print

Shares of Apple Inc. continue to defy gravity. Although most shareholders remain convinced that the company will continue to deliver higher valuations, some might be wondering if the stock's price momentum is due to dwindle. Judging by past periods of market out-performance nervous Nellies should not be worried yet.

If there is a market darling, surely the stock of Apple Inc. (AAPL) is it. Even in the midst of great market uncertainty concerning the global economic picture, Apple’s shareholders seem to be above it all. Its valuation is consistently supported by ever growing revenues and profits. That this tech juggernaut is now the largest company by market capitalization is not even surprising– surpassing in recent weeks the mighty Exxon Mobil (XOM). But when does this blessed investment start to disappoint?


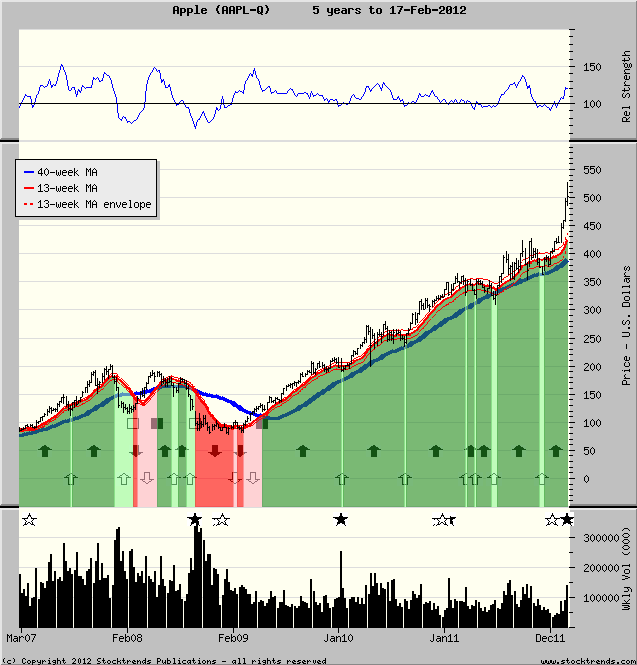
For AAPL, disappointment might only mean a slip in market outperformance. Stock Trends users know that the comparative Relative Strength indicator (RSI) quickly tells us how a stock is doing relative to the market. Currently AAPL has an RSI of 120, which means the stock has outperformed the S&P 500 index over the past 13-weeks by about 20%.
 
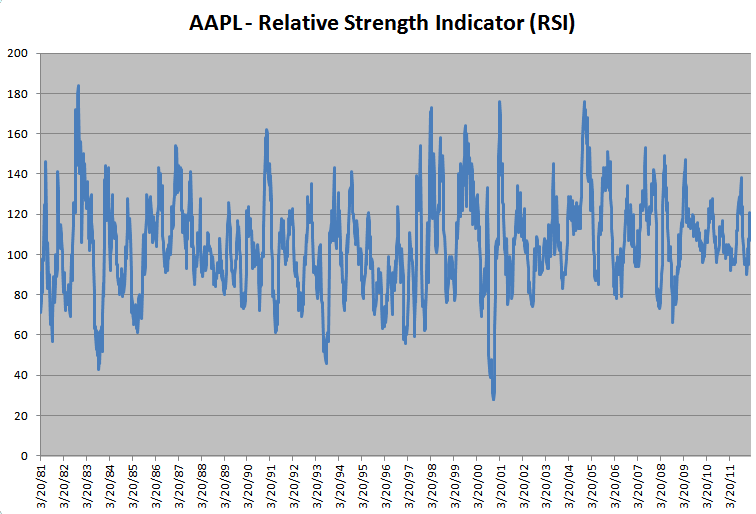
If that seems a bit overextended, keep in mind that the stock has an impressive record as a momentum stock and that the current RSI is still less than one standard deviation (STD) away from its average RSI (121) during periods when shares have outperformed the market. A standard deviation is a measure of variability, so a higher variability of the Relative Strength indicator shows a stock has a tendency to deviate beyond the overall market movements. One standard deviation away from AAPL's average positive RSI (121) would put the indicator at 136. In fact, AAPL has outperformed the market beyond its present margin for 22% of the time during the past three decades.
 
There have been several periods that AAPL’s RSI has topped two standard deviations (positive deviations), and this remains a momentum stock even as it tops all in market cap. By comparison to AAPL’s Relative Strength standard deviation of 16, the Relative Strength standard deviations (during periods these stocks have outperformed the broad market in the last 30-years) of comparable big cap tech stocks Microsoft MSFT (13), IBM (8), Intel INTC (13), Cisco Systems CSCO (15) as well as blue chips in other sectors like Caterpillar CAT (8), Exxon Mobil XOM (6), and General Electric GE (5).  The company's growth in the past five years has not diminished the price momentum of its shares: AAPL's 5-year standard deviation in periods of market outperformance is 12, compared to MSFT (7), IBM (7) and CSCO (6). In short, Apple's stock has a strong tendency toward extending its price momentum compared to other blue chip tech stocks.
 
 
With Apple’s shares trading above $500 after pulling back from their all-time high, investors worried about price momentum fatigue should yield again to its incredible history of defying gravity. The current Stock Trends Bullish trend has been running strong for 145 weeks and appears destined to challenge its longest Bullish trend to date – when the stock powered from the $9 level in the spring of 2003 to above $70 in the summer of 2006. That 678% gain would be hard to duplicate now, but the 311% gain in Apples’s shares since it turned Stock Trends Bullish in May of 2009 is surely not the end of this haul.
back to top

Subscriber Testimonials

  • I am fascinated with your service and methodology - it is very impressive. [...] Over the years I have concluded that there are many ways to approach stock investing, but once one has chosen a path, one is better off sticking to it.

    Bob E., Subscriber

  • Your report is an impressive, excellent tool and I have recommmended it to friends.

    Colin E., Subscriber

  • I very much like the systematic approach to analyzing stock data, it fits my approach.

    Subscriber
  • Stock Trends information is part of the base information I review before making a trade.

    Subscriber
  • I am something of a momentum investor. I find Stock Trends useful as I can look at my portfolio as a “watch list” and quickly see where trends are declining in strength or reversing, so it is particularly useful as a tool in portfolio management regarding sales.

    William C., Subscriber
  • Stock Trends Weekly Reporter is an easy way to pick up equities that represent an upward trend.

    Subscriber
  • I use Stock Trends to help direct my stock picks. Also, following the advice of Stock Trends I have religiously used stop-loss orders and have avoided hanging on to losing stocks for emotional reasons.

    John B., Subscriber
  • Hence, anyone who had followed the "Stock Trends" line should have sold their Bre-X shares and, with the windfall, paid for a lifetime subscription to The Globe and Mail and more. Talk about return on investment!

    Muni P., Subscriber

  • Stock Trends analysis quantifies nicely the movement of individual stocks. I’ve found that if the technicals are out of synch with fundamental analysis, it is a wake-up call to make a decision. The Stock Trends Bull/Bear Ratio is useful in identifying major market bottoms and tops. It has always presented a good buying or selling opportunity.

    Charles G., Subscriber
  • Thank you for your excellent work and kind approach to your customers.

    Odette C., Subscriber

  • You have created and maintained an amazing, highly educational program and I am grateful for your part in getting our retirement funds to the good place they are.

    Karin M., Subscriber
  • I find your website and research very helpful in my stock trading. I have subscribed to several related services in the past and none present their work with “just the facts” as you. Please keep up the great work so that I can continue to learn! 

    Bryan E., Subscriber
  • I want to thank you for posting such an excellent guide to technical analysis on the web. You have provided a great service to all of us novice investors.

    Michael C., Stock Trends user
  • I've followed a number of Stock Trends picks, and the methodology is solid.

    Doug B., Subscriber

  • I am just writing to tell you of my appreciation of your service! It makes so much sense to me. You seem to be an oasis of stability and sensibility in a stockmarket jungle.

    Adrian S., Subscriber

  • I've followed your recommendations since reading your columns in the Globe & Mail, and finding they published Stock Trends arrows in their financial listings. I do find them a guide to the general market and what I should be avoiding for declining chart trends.
    Has probably saved me the subscription by not rushing into hot stocks!

    Anthony D., Subscriber
  • There is a lot to be gained from comparing trends of how individual stocks are doing within a sector, as well as how the sector is performing relative to the broad market.

    Dudley R., Subscriber

  • An admitted cynic, it's obviously very high praise when he says he likes StockTrends because of its "simplicity, utility, openness, [and] honesty," and in addition to having "no hidden agenda" is "understandably documented [and] historically verifiable." And, he adds, "It lets me see a lot of things without doing a lot of work." Globe and Mail

    Paul W., Subscriber

  • Just thought I'd call to thank you, Skot. Stock Trends Weekly Reporter helped pay for my daughter's education!

    Peter H., Subscriber

  • I have had the good fortune to be reasonably successful and enjoy the investment process. Your process would be recommended for both experts and those who are new to investing.

    Frank I., Subscriber

Subscription Plans

Subscription Plans

STWR - Monthly

$19.95

Monthly subscription plan to Stock Trends Weekly Reporter - pay your monthly subscription fees by having them automatically charged (PayPal only). Free 7-day trial period. Subscribers may cancel before the end of any subscription month.

STWR - 1 Year Prepaid Subscription

$199.00

1 Year Prepaid subscription to Stock Trends Weekly Reporter. Save 16% off monthly rate!

STWR - 2 Year Prepaid Subscription

$299.00

2 Year Prepaid subscription to Stock Trends Weekly Reporter. Save 37% off monthly rate!

STWR - 3 Year Prepaid Subscription

$399.00

3 Year Prepaid subscription to Stock Trends Weekly Reporter. Save 44% off monthly rate!

Stock Trends Editorial

  • When Headlines Darken but the Probability Structure Holds
    When Headlines Darken but the Probability Structure Holds The recent Stock Trends editorials argued that hard assets had become structural leaders and that capital was rotating across themes rather than collapsing into a simple risk-on or risk-off binary. This week’s data adds a new layer. The market’s probability structure has improved even as the macro headlines have become more hostile. That is a distinct signal, and it is coming directly from the Stock Trends Inference Model.
    14 March 2026 Read more...
  • War, Inflation, and Rotation: What Stock Trends Reveals After the Middle East Shock
    War, Inflation, and Rotation: What Stock Trends Reveals After the Middle East Shock This week's market headlines have been dominated by war, oil, and inflation fears. However, the Stock Trends context indicates that this is not a broad liquidation. It is a disciplined rotation into sectors tied to scarcity, resilience, and security. Markets do not move from a blank slate. They rotate, they re-price, and they reveal where capital was already preparing to move before the headlines become obvious. This past week’s escalation in the Middle East has undeniably shaken investor confidence, but the latest Stock Trends dataset suggests that the deeper message is not indiscriminate panic. It is a reordering of leadership.
    07 March 2026 Read more...
  • Not Risk-On. Not Risk-Off. Rotation.
    Not Risk-On. Not Risk-Off. Rotation. Not Risk-On. Not Risk-Off. Rotation. In our recent editorial, The Hard Asset Regime Is Not a Trade — It’s a Structure, we examined the persistent leadership emerging in gold and materials and argued that real assets were no longer functioning as short-term hedges, but as structural participants in the market. The current Stock Trends dataset extends that thesis — but in a different direction. The 13-week ST-IM probability model is no longer pointing to a narrow leadership cluster. It is identifying a market redistributing capital across multiple durable themes simultaneously. This is not a simple “risk-on” environment. It is not a defensive “risk-off” retreat. It is rotation.
    02 March 2026 Read more...
  • The Hard-Asset Regime Is Not a Trade — It’s a Structure
    The Hard-Asset Regime Is Not a Trade — It’s a Structure Markets rarely move randomly. They rotate. They reallocate. They transition from one leadership regime to another. And when that transition is real, it shows up not in headlines — but in breadth. This week’s Stock Trends universe reveals something decisive. When we measure common stocks only (removing ETFs that duplicate underlying holdings), two sectors stand apart: Materials and Energy.
    21 February 2026 Read more...
View all Stock Trends Editorials


Subscription Plans

STWR - Monthly

$19.95/Month

Monthly subscription plan to Stock Trends Weekly Reporter - pay your monthly subscription fees by having them automatically charged (PayPal only). Free 7-day trial period. Subscribers may cancel before the end of any subscription month.

STWR - 1 Year Prepaid Subscription

$199/Year

1 Year Prepaid subscription to Stock Trends Weekly Reporter. Save 16% off monthly rate!

STWR - 2 Year Prepaid Subscription

$299/2 Years

2 Year Prepaid subscription to Stock Trends Weekly Reporter. Save 37% off monthly rate!

STWR - 3 Year Prepaid Subscription

$399/3 Years

3 Year Prepaid subscription to Stock Trends Weekly Reporter. Save 44% off monthly rate!