Agrium's current Stock Trends Bearish Crossover indicator, a signal of the penetration of the stock’s intermediate trend line below its primary trend line, is a marker for a trade exit for investors with an eye on the prevailing market mood.
The Stock: Agrium Inc. (AGU) Recent price: $82.92
Trend: Canadian equity investors, so blessed when resource stocks lead the market, are an anxious crowd when commodities lose their investment lustre. Evidence of the clouds above can be found in the withering trend distribution of the TSX, where only 46 per cent of stocks are currently categorized as Stock Trends Bullish. With a downdraft on stocks, those anticipating of a summer rally could be in for a disappointing seasonal play.
When a long-term bull market shows signs of weakness and many stocks drop below their trend lines, analysts and market commentators tend to shift their recommendations to ‘hold’. In truth, their message may be something closer to ‘pray’. For many of the formerly strong commodity trades that propelled the Toronto market the summer period ahead represents an especially holy moment. The spring correction is either an opportune time to buy materials and energy stocks on weakness, or a gloomy prelude of a more bearish commodity trend ahead.
Both the S&P/TSX Materials index and the S&P/TSX Energy index are in Stock Trends Weak Bullish trend categories. The number of constituent materials sector stocks with bearish Stock Trends indicators is on an upswing, with important integrated mining stocks such as Teck Resources (TCK.B) and Sherritt International (S-T) recent Stock Trends Bearish Crossovers. Diversified metal mining, uranium, mining services, and forestry stocks also show fading bull trends or definitive bearish trends prevailing in the materials group.
When stocks correct investors often have trouble calling themselves to action, especially if it is not clear when to throw in the towel on a previously winning trade. Fundamental analysis and value investing often point to better times ahead, demanding a risky commitment to a retreating stock and a more long-term trading horizon. Stock Trends takes a more temporal market timing stance. When the stock price trend reverses, action is advised.
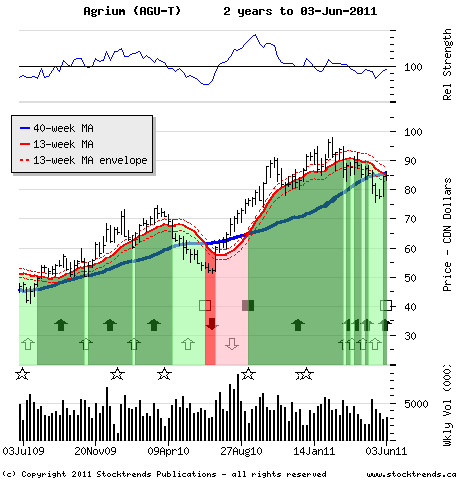
The Trade: The chart pattern of Agrium, the growing fertilizer company with compelling industry prospects aligned with the food demands of the global economy, suggests that trend following shareholders are now faced with an important question: hold or fold. Its current Stock Trends Bearish Crossover indicator, a signal of the penetration of the stock’s intermediate trend line below its primary trend line, generally is a marker for a trade exit for investors with an eye on the prevailing market mood.
Agrium’s share price did rally from $75 to the $86 level in recent weeks, but the hovering 13-week moving average trend line represents a resistance level, now around $85, that is likely to hold back the stock. Its retreat this week to below $83, in conjunction with materials sector weakness, suggests market timing investors take a bearish trade position or sell.
The Upside: More aggressive investors use bearish trend signals to short stocks or trade derivative instruments. Most investors should be content with avoiding the Agrium’s current downside risks, especially if its share price drops below $75.
The Downside: The Stock Trends indicators, published in the Saturday Globe & Mail TSX stock listings, are meant to help investors with an intermediate term (weeks to months) time horizon navigate through the market action. Investors with a longer-term time horizon, and perhaps the willingness to stick with an investment that is on the skids, will put more faith in this stock’s underlying fundamentals. A significant move by Agrium shares back above $86 suggests wisdom in patience.
Published in Stock Trends
 I am fascinated with your service and methodology - it is very impressive. [...] Over the years I have concluded that there are many ways to approach stock investing, but once one has chosen a path, one is better off sticking to it.


