Analysis of the Picks of the Week and ST-IM Select stocks reports shows the returns of the past year matched the expected returns.
The Picks of the Week and the ST-IM Select stocks reports are the main market timing advisories presented in Stock Trends Weekly Reporter. The Picks of the Week report filters for stocks that are changing trend from Bearish to Bullish, with either a Bullish Crossover or Weak Bearish indicator coupled with momentum characteristics. It is based on typical trend analysis doctrine that anticipates a bullish trend (or flat trend) will follow a bearish trend. The ST-IM Select stocks of the Stock Trends Inference Model are derived from a statistical evaluation of returns based on the combination of Stock Trends indicators. It is an evidence-based report on returns already observed, and Select stocks can come from any category of trend - Bullish or Bearish.
Subsequent returns of these reports will be correlated to the market returns, but how well do these reports help investors isolate profitable trading opportunities? Let’s look at a sample of the most recent annual period: the following statistics are derived from all Picks of the Week and ST-IM Select stocks reports from January 20, 2017 to October 20, 2017. We exclude selections from reports less than 13-weeks ago so that there is a sufficient 13-week period of measurement.
Picks of the Week
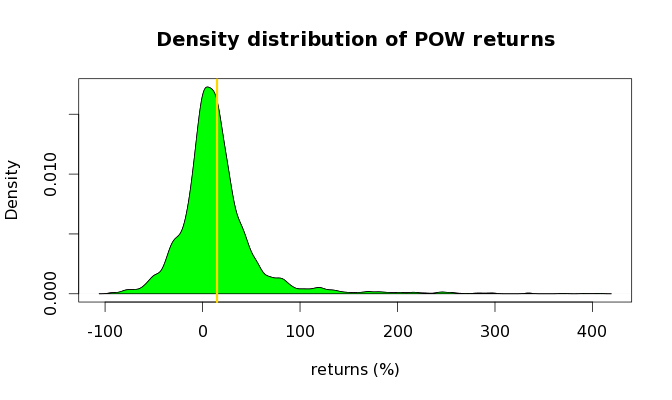
There were 3,204 Picks of the Week selections in the period. Of those, 66.5 % returned a positive outcome as measured from the time of selection to the present (closing price, January 19, 2018). The average return of the sample is 14.6%. The maximum return was registered by Weight Watchers International Inc. (WTW-N) which gained 406% from the date of its first selection on January 27, 2017 at $12.54. Dare Bioscience Inc. (DARE-Q) was a selection on March 17, 2017 at a pre-reverse split price of $3.32 (post-spit $33.20), but it is now the biggest losing selection with its 93% drop.
The sample distribution of returns for these Picks of the Week:
| n | mean | sd | median | min | max | skew | kurtosis |
|---|---|---|---|---|---|---|---|
| 3204 | 14.85 | 42.04 | 9.68 | -93.19 | 406.38 | 2.81 | 15.66 |
n = number, mean = average return (%), sd = standard deviation, min = minimum return (%) ,
max = maximum return (%), skew defined, kurtosis defined
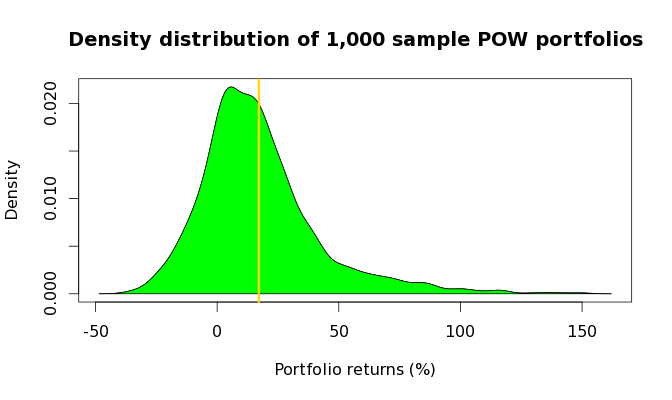
Looking simply at the distribution of returns of the sample, and the relevant standard deviation, is somewhat deceiving since it is unlikely an investor would simply roll the dice once. More likely a subset or group of selections would be made over the course of the period. The pertinent distribution of this sample of stocks can be best represented by sampling the sample - that is, selecting a large number of randomly chosen subsets of stocks and measuring the statistics of these portfolios. For instance, let us assume that 1,000 different investors selected 5 randomly chosen Picks of the Week stocks during the defined period. What are the statistics of these portfolios?
Sampling 1,000 random selections of 5 Picks of the Week reports during the defined period we discover 79.5 % of these random POW portfolios returned a positive outcome. The mean or average return of these portfolios is 17.1%, with a maximum return of 149% and a maximum loss of 36%.
The distribution of these portfolio returns is represented here:
| n | mean | sd | median | min | max | skew | kurtosis |
|---|---|---|---|---|---|---|---|
| 1000 | 17.14 | 24.38 | 13.29 | -35.75 | 149.24 | 1.41 | 3.44 |
The Picks of the Week selections are either Bullish Crossovers (![]() ) or Weak Bearish (
) or Weak Bearish (![]() ) stocks. The subsequent average return of the Bullish Crossover stocks is 13.5%, while the subsequent average return of the Weak Bearish selections is 15.4%.
) stocks. The subsequent average return of the Bullish Crossover stocks is 13.5%, while the subsequent average return of the Weak Bearish selections is 15.4%.
Returns (%) by trend for POW stocks
| trend | n | mean | sd | median | min | max | skew | kurtosis |
|---|---|---|---|---|---|---|---|---|
| |
973 | 13.54 | 42.08 | 8.16 | -85.58 | 334.68 | 2.88 | 14.73 |
| |
2231 | 15.42 | 42.02 | 10.12 | -93.19 | 406.38 | 2.77 | 16.08 |
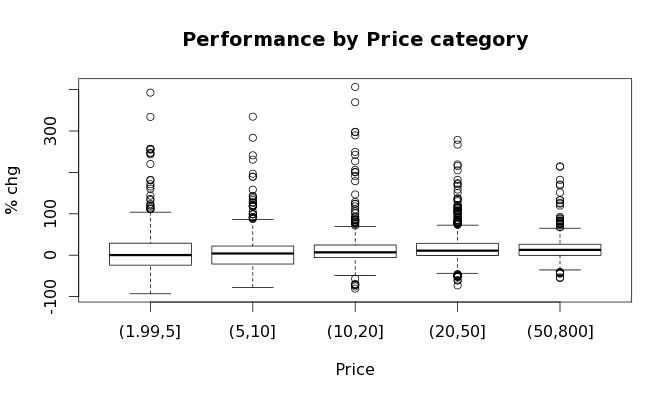
The following box plots show the returns of these Picks of the Week stocks categorized by trend, by price and by RSI:
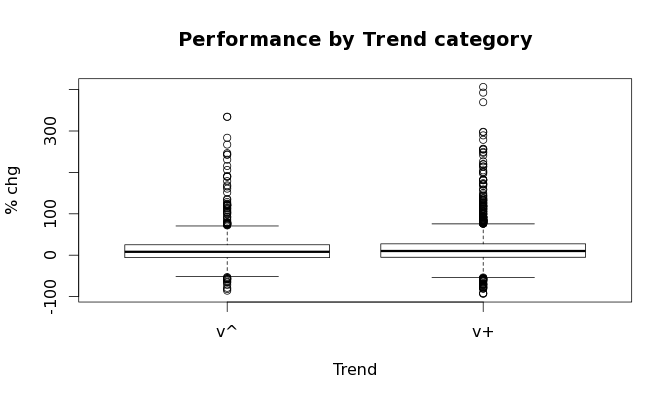
Note: v^ = Bullish Crossover (![]() ), v+ = Weak Bearish (
), v+ = Weak Bearish (![]() )
)
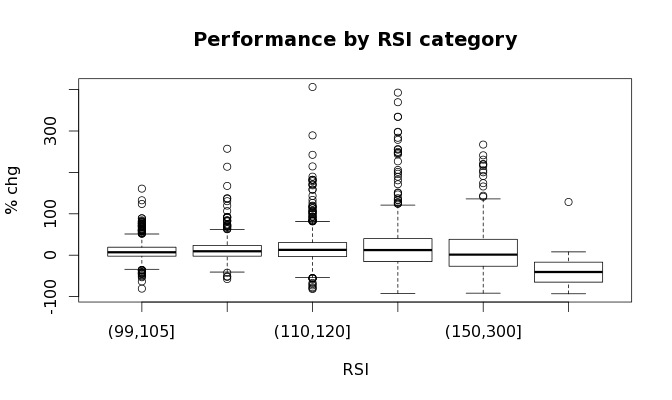
Note: RSI ranges: 100-105, 105-110, 110-120, 120-150, 150-300, 300 plus
ST-IM Select stocks
Select stocks are based on estimated returns over prescribed periods - 4-week, 13-week, and 40-week periods. We will focus on the 13-week and 40-week returns post-Select-date in the ST-IM Select stocks report.
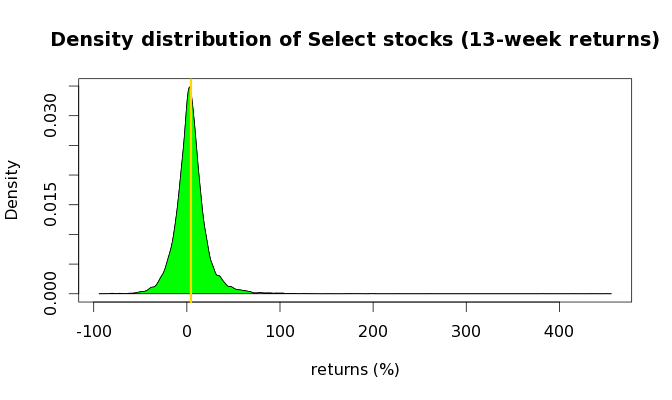
Of the 12,685 ST-IM Select stocks during the period, 61.6 % returned a positive outcome in the subsequent 13-week period. The average return was 4.4%, with a maximum return of 450% (Straight Path Communications Inc., STRP-A) and a maximum loss of -89% (Versartis Inc., VSAR-Q). The expected 13-week return of a randomly selected stock is a return of 2.14%, so the sample generated a mean return that is slightly more than double the expected returns of the population.
Recall, though, that the Select stocks requirement is that a selection must have a 55% or greater probability of bettering the expected random 13-week return of 2.19%. However, the percentage of this sample of Select stocks that bettered the return of a randomly selected stock (in the broad market, across time - a 2.19% return) is 54.4%. This result is marginally below what the model predicted (minimum 55%).
While the Picks of the Week reports filter through only Weak Bearish and Bullish Crossover stocks, the ST-IM Select stocks report includes all stocks with a probability of exceeding the expected 4-week, 13-week, and 40-week returns of a randomly selected stock. The statistical description of subsequent 13-week returns by each of the Stock Trends indicator category groups follows:
13-week return by trend for Select stocks
| trend | n | mean | sd | median | min | max | skew | kurtosis |
|---|---|---|---|---|---|---|---|---|
| 1562 | 4.83 | 16.82 | 3.5 | -89.0 | 111.8 | 0.65 | 3.64 | |
| 10551 | 4.52 | 19.92 | 3.5 | -84.1 | 450.5 | 4.86 | 84.03 | |
| 153 | 4.57 | 10.46 | 4.4 | -27.5 | 44.2 | 0.27 | 1.12 | |
| 217 | -1.11 | 27.2 | -5.3 | -78.6 | 133.6 | 1.09 | 3.59 | |
| 56 | 0.17 | 17.07 | 2.5 | -72.9 | 47.9 | -1.22 | 5.26 | |
| 146 | 1.05 | 24.55 | 1.05 | -63.0 | 128.4 | 1.17 | 4.68 |
The overwhelming majority of Select stocks during the period were Stock Trends Bullish (![]() ). The mean or average 13-week return of this group (4.54%) was only marginally exceeded by Weak Bullish (
). The mean or average 13-week return of this group (4.54%) was only marginally exceeded by Weak Bullish (![]() ) and Bearish Crossover (
) and Bearish Crossover (![]() ) Select stocks.
) Select stocks.
The poorest performing Select stocks had Bearish (![]() ), Weak Bearish (
), Weak Bearish (![]() ), and Bullish Crossover (
), and Bullish Crossover (![]() ) trend indicators. While this 13-week return analysis does tell us something about the nature of price movement during the period - most of the market price momentum was driven by stocks in established bull trends - we should evaluate the longer-term 40-week returns of these Select stocks to see if the results are differentiated. Below are the subsequent 40-week returns of Select stocks by Stock Trends indicator category:
) trend indicators. While this 13-week return analysis does tell us something about the nature of price movement during the period - most of the market price momentum was driven by stocks in established bull trends - we should evaluate the longer-term 40-week returns of these Select stocks to see if the results are differentiated. Below are the subsequent 40-week returns of Select stocks by Stock Trends indicator category:
40-week return by trend for Select stocks
| trend | n | mean | sd | median | min | max | skew | kurtosis |
|---|---|---|---|---|---|---|---|---|
| 391 | 9.62 | 33.05 | 7.1 | -77.1 | 230.2 | 1.78 | 9.55 | |
| 2854 | 14.41 | 41.71 | 8.6 | -90.5 | 456.3 | 2.73 | 20.01 | |
| 6 | 7.92 | 44.02 | 4.6 | -56.3 | 81.7 | 0.27 | -0.93 | |
| 44 | 1.52 | 56.38 | -2.65 | -80.3 | 302.9 | 3.31 | 15.86 | |
| 21 | 13.74 | 38.23 | 7.0 | -37 | 134.8 | 1.54 | 2.5 | |
| 58 | 0.44 | 56.8 | -3.75 | -79.6 | 313.8 | 2.93 | 13.66 |
Here we see again that the vast majority of ST-IM Select stocks (of those that had the required 40-weeks after selection to measure the return statistic) were Stock Trends Bullish (![]() ). The mean or average 40-week return of this group is 14.41%, slightly better than the 13.4% average 40-week return of all Select stocks in this period. The mean 40-week return of a randomly selected stock in the market (across all time) is 6.45%, so the results of this Select stocks sample correspond as well with our Stock Trends Inference Model expectations in terms of expected returns.
). The mean or average 40-week return of this group is 14.41%, slightly better than the 13.4% average 40-week return of all Select stocks in this period. The mean 40-week return of a randomly selected stock in the market (across all time) is 6.45%, so the results of this Select stocks sample correspond as well with our Stock Trends Inference Model expectations in terms of expected returns.
Of note among the trend grouping of 40-week returns is the 13.7% return of Bullish Crossover (![]() ) stocks. This outperformance of the expected 40-week return contrasts with the underperformance of the expected 13-week return reported above for the same Bullish Crossover group. However, only 21 Bullish Crossover Select stocks have the required 40-weeks to measure the statistic, compared to the 56 that recorded the lesser 13-weeks to measure that statistic. Remember, the Bullish Crossover indicates the first week of a Bullish trend, so this result possibly differentiates the performance of stocks relative to the duration of their trend. I’ll examine this in a future editorial.
) stocks. This outperformance of the expected 40-week return contrasts with the underperformance of the expected 13-week return reported above for the same Bullish Crossover group. However, only 21 Bullish Crossover Select stocks have the required 40-weeks to measure the statistic, compared to the 56 that recorded the lesser 13-weeks to measure that statistic. Remember, the Bullish Crossover indicates the first week of a Bullish trend, so this result possibly differentiates the performance of stocks relative to the duration of their trend. I’ll examine this in a future editorial.
 Just thought I'd call to thank you, Skot. Stock Trends Weekly Reporter helped pay for my daughter's education!


