High-Volume Leaders: A Closer Look at the Heaviest-Traded Stocks

  • 03 November 2025 |
  • Written by  Skot Kortje, Stock Trends Analyst
  • font size
  • Print

Stock Trends’ Unusually High Volume (ST SolidStar2) indicator flags stocks whose weekly trading volume is at least 200% of their 13-week average. In the October 31 weekly reports, only a small slice of the universe qualifies—making these signals rare and valuable. When high volume coincides with a bullish trend state (or a new Bullish Crossover), it can mark institutional footprints at the start of a multi-week advance.

How to Read the Signals (Quick Refresher)

  • Bullish (ST BullishSmall): Price is decisively above the 13- and 40-week moving averages.
  • Weak Bullish (ST WeakBullishSmall): Temporary dip below the 13-week average while the long-term uptrend persists; may precede a Bearish Crossover but often reverts back to Bullish.
  • Bullish Crossover (ST BullishXoverSmall): 13-week MA crosses above the 40-week MA—often the start of a major up-leg, especially if volume is high.

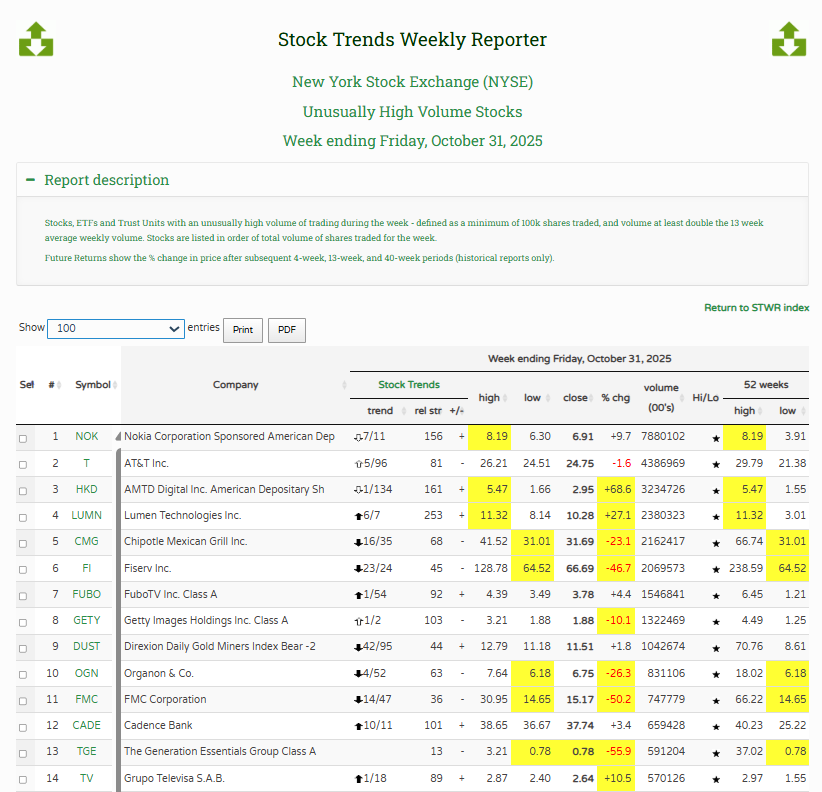
STWR Unusually High Volume report

Subscribers to Stock Trends Weekly Reporter can review the Unusually High Volume filter report for each exchange to isolate stocks with significant changes in the weekly traded volume. Here is a snippet of this week's NYSE Usually High Volume report:

NYSE High Volume report 2025 10 31

Select High-Volume (ST SolidStar2) Leaders & Why They’re Active

Semiconductors & Networking

  • AXT Inc. (AXTI-Q) — Compound semiconductor wafer supplier with strong intermediate momentum. High volume aligns with renewed demand for specialty substrates used in 5G, LiDAR and AI hardware build-outs.
  • Cambium Networks (CMBM-Q) — Wireless broadband equipment vendor showing heavy accumulation after product and ecosystem updates tied to enterprise connectivity. Elevated volume reflects institutional positioning for deployment cycles.

Biotechnology & Life Sciences

  • Inhibrx Biosciences (INBX-Q) — High volume paired with a Bullish trend. Pipeline updates and partner visibility continue to draw interest.
  • Cabaletta Bio (CABA-Q) — Early-stage gene-therapy name with unusual volume. Typical accumulation pattern ahead of program milestones; the recent Bullish Crossover followed by persistent volume is a powerful confirmation.
  • Arcus Biosciences (RCUS-N) — Oncology developer with partner leverage. Heavy trading suggests institutions are extending timelines for immuno-oncology catalysts.
  • BridgeBio Pharma (BBIO-Q) — Multi-asset rare-disease platform. Sustained high volume consistent with follow-through after positive program data and regulatory traction. The stock is listed in this week's Nasdaq Select stocks report, with Stock Trends Inference Model (ST-IM) Bullish forward return expectations and outperformance probabilities across the 4-week, 13-week, and 40-week periods ahead.

Communication Services

Energy

  • T1 Energy (TE-N) — High-volume rotation into cyclicals as energy pricing stabilizes. Monitor for rising 13-week return expectations to confirm trend persistence.

Other notable high-volume (ST SolidStar2) stocks in the current Nasdaq ST-IM Select stocks report:

FormFactor Inc. FORM-Q

Incyte Corporation INCY-Q

 Action Plan for Stock Trends Weekly Reporter Subscribers

  1. Open the Unusually High Volume filter report in the STWR filter reports (by exchange).
  2. Cross-check trend state: prioritize Bullish and Bullish Crossover names with high volume; track Weak Bullish names for return-to-Bullish entries.
  3. Layer in Bullish Crossover and Bullish Crossover Predictions filters. A stock that appears in both a crossover list and the high-volume list deserves immediate attention.
  4. Check Weak Bearish (ST WeakBearishSmall) stocks and weekly Picks of the Week reports for High Volume indicators. The Newly Weak Bearish report will also help isolate early reversals.
  5. Check the weekly ST-IM Select stocks report for each exchange for high-volume stocks.
  6. Confirm with the individual Stock Trends Report pages (links above): review Trend Profile, Industry and Fundamentals tabs for alignment with your risk budget.

Note on interpretation: Weak Bullish trends often precede Bearish Crossovers, but they also frequently revert back to Bullish. Many recent Weak Bullish names in this dataset have rebounded to (Strong) Bullish—precisely where high-volume confirmation is most informative. Alternatively, Weak Bearish trends often precede Bullish Crossovers (that's why they are a major focus of Stock Trends reports like the Picks of the Week), but they can also revert to (Strong) Bearish.

back to top

Subscriber Testimonials

  • Stock Trends Weekly Reporter is an easy way to pick up equities that represent an upward trend.

    Subscriber
  • I am fascinated with your service and methodology - it is very impressive. [...] Over the years I have concluded that there are many ways to approach stock investing, but once one has chosen a path, one is better off sticking to it.

    Bob E., Subscriber

  • I've followed your recommendations since reading your columns in the Globe & Mail, and finding they published Stock Trends arrows in their financial listings. I do find them a guide to the general market and what I should be avoiding for declining chart trends.
    Has probably saved me the subscription by not rushing into hot stocks!

    Anthony D., Subscriber
  • An admitted cynic, it's obviously very high praise when he says he likes StockTrends because of its "simplicity, utility, openness, [and] honesty," and in addition to having "no hidden agenda" is "understandably documented [and] historically verifiable." And, he adds, "It lets me see a lot of things without doing a lot of work." Globe and Mail

    Paul W., Subscriber

  • Hence, anyone who had followed the "Stock Trends" line should have sold their Bre-X shares and, with the windfall, paid for a lifetime subscription to The Globe and Mail and more. Talk about return on investment!

    Muni P., Subscriber

  • I very much like the systematic approach to analyzing stock data, it fits my approach.

    Subscriber
  • Stock Trends analysis quantifies nicely the movement of individual stocks. I’ve found that if the technicals are out of synch with fundamental analysis, it is a wake-up call to make a decision. The Stock Trends Bull/Bear Ratio is useful in identifying major market bottoms and tops. It has always presented a good buying or selling opportunity.

    Charles G., Subscriber
  • I am something of a momentum investor. I find Stock Trends useful as I can look at my portfolio as a “watch list” and quickly see where trends are declining in strength or reversing, so it is particularly useful as a tool in portfolio management regarding sales.

    William C., Subscriber
  • I find your website and research very helpful in my stock trading. I have subscribed to several related services in the past and none present their work with “just the facts” as you. Please keep up the great work so that I can continue to learn! 

    Bryan E., Subscriber
  • There is a lot to be gained from comparing trends of how individual stocks are doing within a sector, as well as how the sector is performing relative to the broad market.

    Dudley R., Subscriber

  • Your report is an impressive, excellent tool and I have recommmended it to friends.

    Colin E., Subscriber

  • I have had the good fortune to be reasonably successful and enjoy the investment process. Your process would be recommended for both experts and those who are new to investing.

    Frank I., Subscriber
  • I am just writing to tell you of my appreciation of your service! It makes so much sense to me. You seem to be an oasis of stability and sensibility in a stockmarket jungle.

    Adrian S., Subscriber

  • I want to thank you for posting such an excellent guide to technical analysis on the web. You have provided a great service to all of us novice investors.

    Michael C., Stock Trends user
  • Just thought I'd call to thank you, Skot. Stock Trends Weekly Reporter helped pay for my daughter's education!

    Peter H., Subscriber

  • You have created and maintained an amazing, highly educational program and I am grateful for your part in getting our retirement funds to the good place they are.

    Karin M., Subscriber
  • Stock Trends information is part of the base information I review before making a trade.

    Subscriber
  • I've followed a number of Stock Trends picks, and the methodology is solid.

    Doug B., Subscriber

  • Thank you for your excellent work and kind approach to your customers.

    Odette C., Subscriber

  • I use Stock Trends to help direct my stock picks. Also, following the advice of Stock Trends I have religiously used stop-loss orders and have avoided hanging on to losing stocks for emotional reasons.

    John B., Subscriber

Subscription Plans

Subscription Plans

STWR - Monthly

$19.95

Monthly subscription plan to Stock Trends Weekly Reporter - pay your monthly subscription fees by having them automatically charged (PayPal only). Free 7-day trial period. Subscribers may cancel before the end of any subscription month.

STWR - 1 Year Prepaid Subscription

$199.00

1 Year Prepaid subscription to Stock Trends Weekly Reporter. Save 16% off monthly rate!

STWR - 2 Year Prepaid Subscription

$299.00

2 Year Prepaid subscription to Stock Trends Weekly Reporter. Save 37% off monthly rate!

STWR - 3 Year Prepaid Subscription

$399.00

3 Year Prepaid subscription to Stock Trends Weekly Reporter. Save 44% off monthly rate!

Stock Trends Editorial

  • Leadership Beneath the Surface: How Stock Trends Identifies System-Critical Equities
    Leadership Beneath the Surface: How Stock Trends Identifies System-Critical Equities The broad market still reads as a rotation market rather than a generalized expansion phase. Energy, Materials, and Utilities remain the clearest sector-level leadership blocs, but the current Stock Trends dataset shows that a second layer of leadership is now becoming more visible beneath the sector averages. That secondary leadership is important because it does not present itself as broad participation. It appears instead through specific industry groups whose internal trend structure is materially stronger than that of their parent sectors. In this week’s data, the clearest examples are Semiconductors and Equipment, Telecommunications, Containers & Packaging, and Banking.
    29 March 2026 Read more...
  • Indexing Is the Baseline—Probability Is the Edge
    Indexing Is the Baseline—Probability Is the Edge The case for indexing continues to strengthen, and rightly so. The evidence is overwhelming: most active managers fail to outperform their benchmarks over time, and the costs of attempting to do so only compound the underperformance. For many investors, indexing has become not just a strategy, but the default solution. But the conclusion that often follows—that markets cannot be meaningfully outperformed—is where the interpretation begins to break down. The failure of traditional active management is not evidence that opportunity does not exist. It is evidence that non-probabilistic selection fails.
    24 March 2026 Read more...
  • Continuation, Not Expansion: What the Probability Structure Now Reveals
    Continuation, Not Expansion: What the Probability Structure Now Reveals The current market is not offering investors the kind of broad speculative expansion that often defines the early phase of a powerful advance. Nor is it confirming a simple risk-off breakdown. The latest Stock Trends dataset points to something more disciplined. The probability structure remains constructive, but it is now being expressed primarily through continuation and consolidation rather than broad breakout expansion.
    21 March 2026 Read more...
  • When Headlines Darken but the Probability Structure Holds
    When Headlines Darken but the Probability Structure Holds The recent Stock Trends editorials argued that hard assets had become structural leaders and that capital was rotating across themes rather than collapsing into a simple risk-on or risk-off binary. This week’s data adds a new layer. The market’s probability structure has improved even as the macro headlines have become more hostile. That is a distinct signal, and it is coming directly from the Stock Trends Inference Model.
    14 March 2026 Read more...
View all Stock Trends Editorials


Subscription Plans

STWR - Monthly

$19.95/Month

Monthly subscription plan to Stock Trends Weekly Reporter - pay your monthly subscription fees by having them automatically charged (PayPal only). Free 7-day trial period. Subscribers may cancel before the end of any subscription month.

STWR - 1 Year Prepaid Subscription

$199/Year

1 Year Prepaid subscription to Stock Trends Weekly Reporter. Save 16% off monthly rate!

STWR - 2 Year Prepaid Subscription

$299/2 Years

2 Year Prepaid subscription to Stock Trends Weekly Reporter. Save 37% off monthly rate!

STWR - 3 Year Prepaid Subscription

$399/3 Years

3 Year Prepaid subscription to Stock Trends Weekly Reporter. Save 44% off monthly rate!