7% avg. annual return
TSX Financials Bullish CrossoverCurrent Strategy SummaryBuys: 0 Sells: 0 Performance2026 ytd: +25.0% |
| Current Portfolio Report | Portfolio History Report |
| (subscribers only - Login ID and password required) |
|
The TSX Financials Bullish Crossover Portfolio trading strategy:
|
|---|
|
BUY a TSX-listed Financials stock when:
tagged with a “Bullish Crossover” indicator
|
|
SELL a stock when:
tagged with a “Bearish Crossover” indicator
|
The money management rules for the portfolio are as follows:
Exposure to each position is limited to $10,000.
Transaction costs are factored into the cost of purchases and the net proceeds of sales at 1% in and 1% out, or 2% commission on a round trip.
Applying this very simple trading system on the Stock Trends 27-year historical data of TSX-listed financial stocks generates the following results:
ST TSX Financials Bullish Crossovers Portfolio Strategy Performance - 1995 to 2021:
| Year | Avg Invested Capital ($) | Net Gain/(Loss) ($) | ST Portfolio (%)* | S&P/TSX(%) | Difference (%) |
| 2021 | 210,189 | 60,916 | 29.0 | 21.7 | 7.3 |
| 2020 | 54,906 | 16,759 | 32.4 | 2.7 | 29.7 |
| 2019 | 15,283 | 873 | 5.8 | 20.7 | -14.9 |
| 2018 | 98,491 | -18,067 | -18.0 | -12.3 | -5.7 |
| 2017 | 135,660 | 989 | 0.7 | 6.0 | -5.3 |
| 2016 | 125,660 | 9,256 | 7.4 | 17.5 | -10.1 |
| 2015 | 70,566 | -16,264 | -23.1 | -8.9 | -14.2 |
| 2014 | 180,377 | 17,511 | 9.7 | 7.5 | 2.2 |
| 2013 | 171,132 | 48,118 | 28.2 | 10.3 | 17.9 |
| 2012 | 104,151 | -9,428 | -9.1 | 3.0 | -12.1 |
| 2011 | 107,547 | -10,754 | -9.8 | -11.1 | 1.3 |
| 2010 | 137,358 | -5,219 | -3.8 | 14.5 | -18.3 |
| 2009 | 110,189 | 31,497 | 28.9 | 41.4 | -12.5 |
| 2008 | 30,943 | -26,357 | -84.1 | -39.9 | -44.2 |
| 2007 | 162,264 | 16,457 | 10.1 | 7.1 | 3.0 |
| 2006 | 166,226 | 31,005 | 18.7 | 14.3 | 4.4 |
| 2005 | 182,075 | 47,016 | 25.8 | 21.9 | 3.9 |
| 2004 | 150,566 | 15,229 | 10.1 | 13.5 | -3.4 |
| 2003 | 134,717 | 31,261 | 23.4 | 23.1 | 0.3 |
| 2002 | 75,660 | -16,330 | -21.3 | -13.6 | -7.7 |
| 2001 | 96,226 | 8,244 | 8.5 | -13.8 | 22.3 |
| 2000 | 84,528 | 32,090 | 38.4 | 5.6 | 32.8 |
| 1999 | 33,019 | -13,445 | -40.4 | 29.6 | -70.0 |
| 1998 | 73,019 | -34,410 | -46.4 | -1.1 | -45.3 |
| 1997 | 109,623 | 89,681 | 81.7 | 11.5 | 70.2 |
| 1996 | 101,698 | 70,469 | 69.4 | 25.1 | 44.3 |
| 1995 | 87,358 | 13,809 | 15.8 | 11.6 | 4.2 |
Trading Statistics
| Total # of positions taken: | 340 |
| # of winning positions (winning %): | 164 (48.2%) |
| Average gain(%) per winning position: | 35% |
| Average loss(%) per losing position: | 10% |
| Profit factor**: | 3.1 |
| Maximum gain(%) on a position: | 370% |
| Maximum loss(%): | -73% |
| Annualized return on average invested capital: | 12.9% |
| Average invested capital: | $110,786 |
| Average # of positions held: | 11 |
| Average # of weeks invested in each position: | 46 |
|
* trading stats compiled at December 31, 2021 **Profit Factor = (% of winning trades X average $ gains on winning trades) / ABSOLUTE VALUE[(% of losing trades X average $ losses on losing trades)] |
|
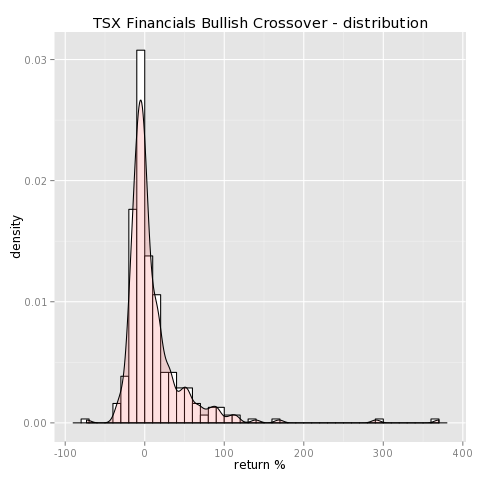
The current TSX Financials Bullish Crossover Portfolio report is published weekly. It shows current holdings, as well as current buy and sell transactions. Investors can follow the report to emulate the performance of the portfolio or use this model portfolio to adjust their own holdings in these important Nasdaq stocks.
