Stock Trends empowers investors to spot early opportunities by combining its proprietary trend indicators with a disciplined technical framework. Through weekly reports like the Top Trending Stocks and Low Volume Gains, along with Special Listings for ETFs—subscribers can systematically interpret market activity and assess trend strength across both equities and thematic funds.
Using the Stock Trends Weekly Reporter Filters
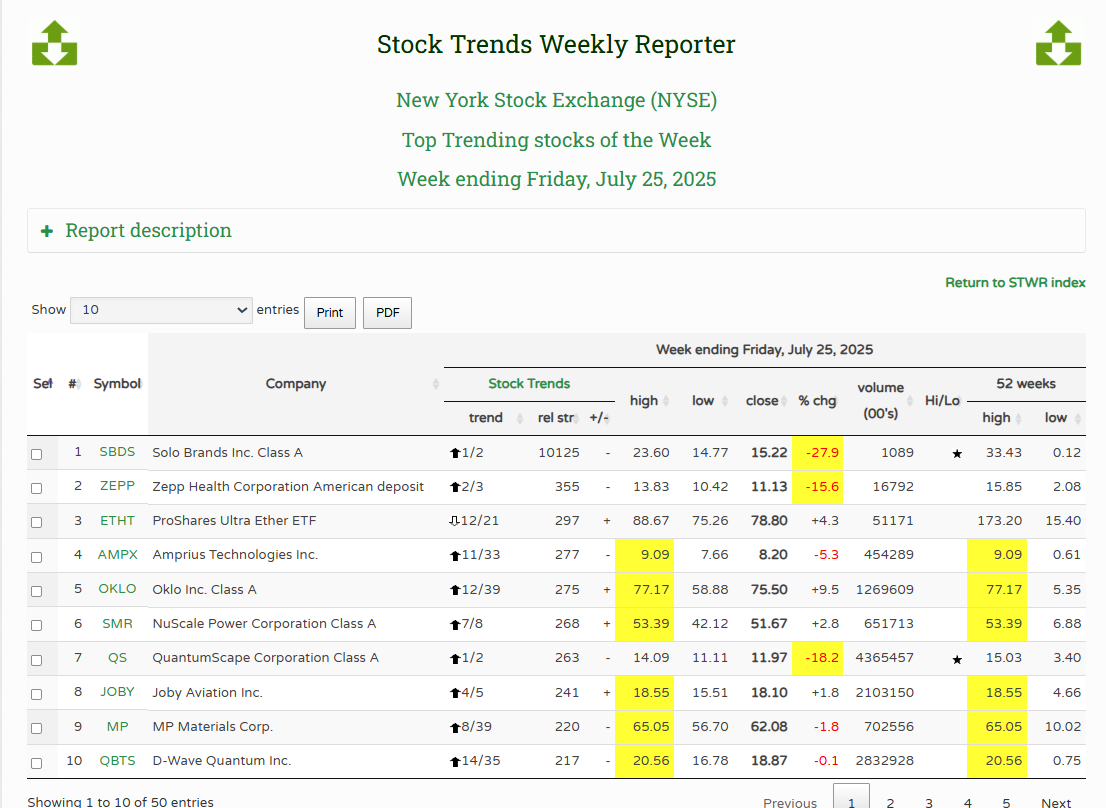
The Top Trending Stocks of the Week report highlights stocks priced above US$5 that are trading with both short- and intermediate-term momentum. To qualify, a stock must be assigned one of the Stock Trends Bullish (![]() ) or Weak Bearish (
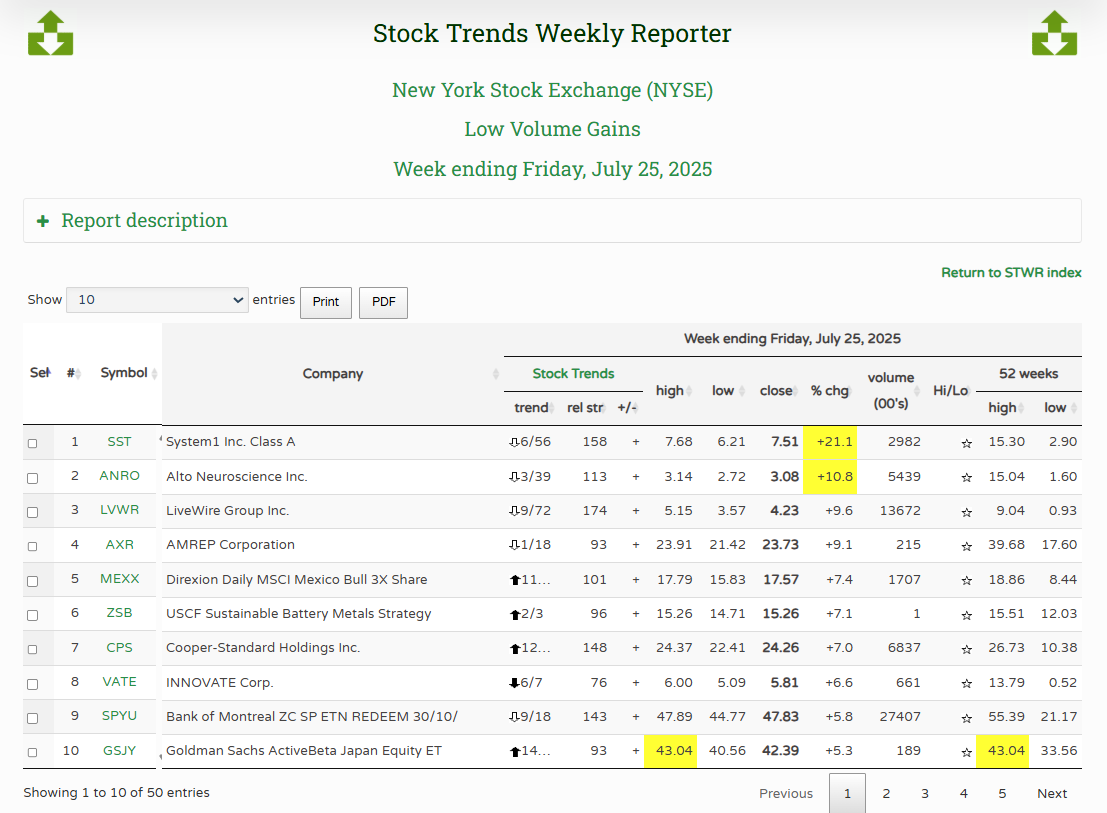
) or Weak Bearish (![]() ) trend indicators and have weekly trading volume over 100,000 shares. The Low Volume Gains report is ranked by % change in price over the week, showing which stocks and ETFs performed better than the index this week while advancing on unusually weak volume
) trend indicators and have weekly trading volume over 100,000 shares. The Low Volume Gains report is ranked by % change in price over the week, showing which stocks and ETFs performed better than the index this week while advancing on unusually weak volume ![]() (no more than 1/2 of the 13 week average weekly volume). Stocks gaining on low volume alert us to situations of both concern and interest. Additionally, the ETF listing reports flags sectors/industries and asset classes that reveal investor rotation.
(no more than 1/2 of the 13 week average weekly volume). Stocks gaining on low volume alert us to situations of both concern and interest. Additionally, the ETF listing reports flags sectors/industries and asset classes that reveal investor rotation.
Each report listing includes:
- Trend indicator: Stocks are classified into six categories, including Bullish
 , Weak Bullish
  , Weak Bearish
  , and Bearish
  , with crossovers (
 ,
,  ) marking new trend initiations.
 - RSI (Relative Strength Index): The 13-week price performance versus the benchmark market index - S&P 500 (or S&P/TSX for TSX stocks). Scores above 100 indicate outperformance. A plus sign (+) denotes a weekly outperformance.
- Volume tags: A (
 ) marks weekly volume double the 13-week average, while a (
 ) flags below-average volume.
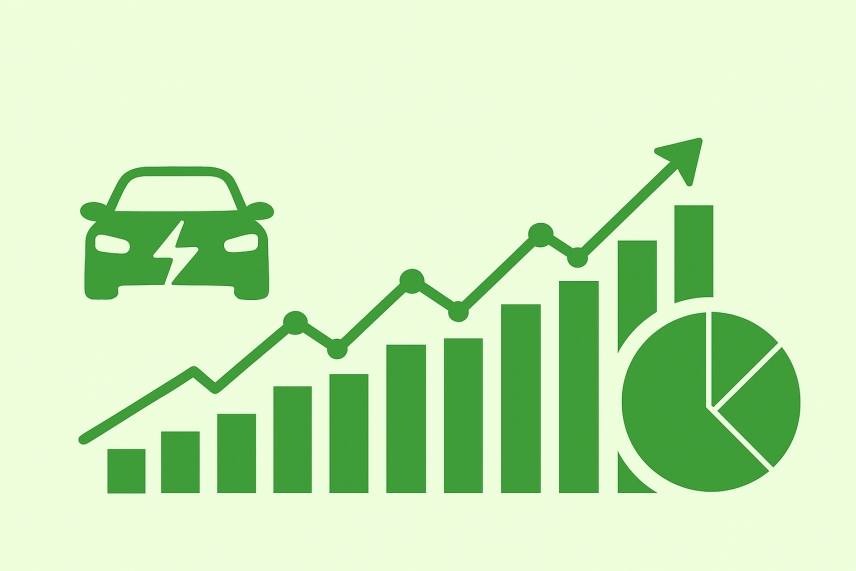
Battery-Metals and EV Themes in Focus
The July 25, 2025 reports reveal growing strength in electrification themes. Below are several companies showing strong Stock Trends indicators, backed by sector momentum and selected industry news:
| Company | Trend | 13-week Change | RSI | Volume Tag |
|---|---|---|---|---|
| Amprius Technologies (AMPX) | Strong Bullish |
+220.3% | 277 | None |
| QuantumScape (QS) | Bullish |
+203.8% | 263 | |
| LiveWire Group (LVWR) | Weak Bearish |
+101.4% | 174 |
Supporting Developments
- Amprius announced high-performance silicon-anode battery advancements and a new EV OEM partnership. Analysts expect increased output once its Colorado plant opens.
- QuantumScape remains a leader in solid-state battery innovation, with continued institutional interest despite volatility.
- LiveWire, a Harley-Davidson spinoff, is growing its EV motorcycle lineup and expanding delivery programs.
ETF Listings Validate Sector Rotation
Stock Trends’ ETF reports offer a broad view of sector participation. For the week ending July 25, five funds tied to battery metals and mining surfaced with trend signals:
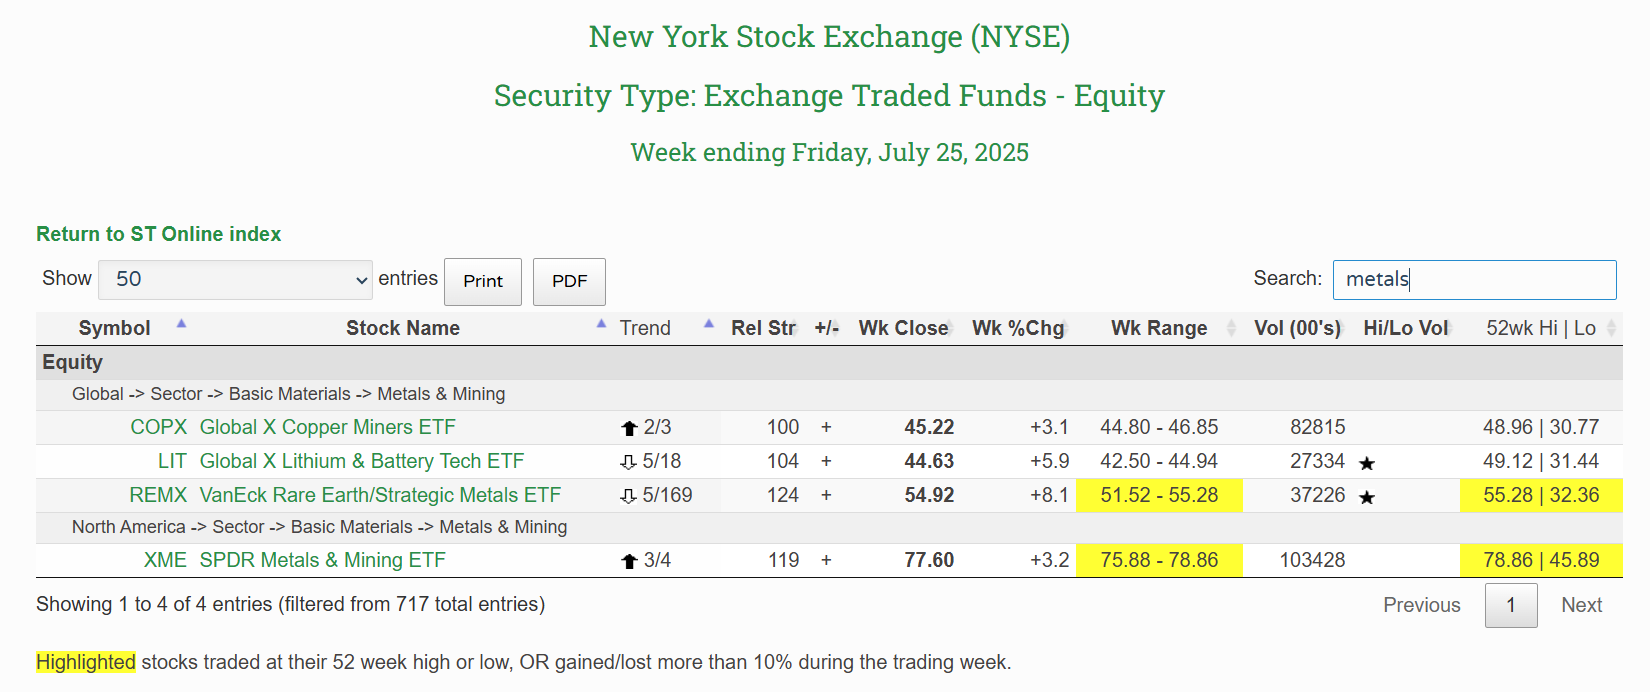
| ETF | Trend/ Trend counters | 13-week Change | RSI | Volume Tag |
|---|---|---|---|---|
| Global X Copper Miners ETF (COPX) | Strong Bullish |
+15.4% | RSI 100 (+) | None |
| Global X Lithium & Battery Tech ETF (LIT) | Weak Bearish |
+20.7% | RSI 104 (+) | |
| VanEck Rare Earth/Strategic Metals ETF (REMX) | Weak Bearish |
+43.0% | RSI 124 (+) | |
| SPDR Metals & Mining ETF (XME) | Strong Bullish |
+37.3% | RSI 119 (+) | None |
| USCF Sustainable Battery Metals Strategy ETF (ZSB) | Bullish |
+11.0% | RSI 96 |
Sector Insights
- Lithium prices have rebounded since April, and copper demand is projected to double by 2035 (IEA).
- ETF inflows into battery and metals funds rose in Q2 as investors rotated into electrification themes.
Supporting the Thesis: Industry and Macro Drivers
Battery and EV equities are not moving in a vacuum. The following developments offer fundamental support to the Stock Trends signals:
- EV adoption forecasts: BloombergNEF projects global EV sales to top 20 million in 2025, up from 14 million in 2023. U.S. EV penetration is rising from 7.6% toward double digits.
- Battery innovation: DOE and private capital are funding solid-state and lithium-metal tech; high-silicon anodes (like Amprius) are favored for aerospace and luxury EV applications.
- Government policy: The Inflation Reduction Act and CHIPS Act are directing billions into domestic battery production and supply chain security.
- Metal supply constraints: IEA warns of long-term underinvestment in critical metals. Copper demand is expected to double by 2035; lithium, nickel, and rare earths face similar pressure.
Using Stock Trends for Actionable Signals
Stock Trends indicators help investors interpret technical signals with confidence. While stocks like QuantumScape and Amprius show high-RSI momentum, investors should be mindful of trend maturity and weekly volatility. Meanwhile, ETF signals confirm broad accumulation across electrification supply chains, particularly in metals and battery technology.
By combining Stock Trends’ disciplined trend analysis with awareness of sector catalysts, investors gain a robust edge in spotting high-conviction opportunities within the evolving electrification landscape.
Related items
- War, Inflation, and Rotation: What Stock Trends Reveals After the Middle East Shock
- Not Risk-On. Not Risk-Off. Rotation.
- The Hard-Asset Regime Is Not a Trade — It’s a Structure
- Understanding Our Assumptions — A Decade Later
- Navigating Market Turmoil in December 2025 – How Stock Trends Guides Investors