A trend-following trading system can be both simple and profitable. The Dow Jones Industrials Bullish Crossover Portfolio is just one example of how long-term investors can use the Stock Trends indicators.
The Stock Trends Bullish Crossover (![]() ) and Bearish Crossover (
) and Bearish Crossover (![]() ) are key signals that a long-term price trend has changed, but for many investors these moving average indicators appear to be too lagging current market prices to generate trading success. Indeed, the premise of trend analysis is that moving average market timing buy signals forgo early price movement in order to definitively categorize a new price trend, and that trade exit markers provided by moving averages are well behind price action trade exits – a dual handicap that some investors would find intolerable.
) are key signals that a long-term price trend has changed, but for many investors these moving average indicators appear to be too lagging current market prices to generate trading success. Indeed, the premise of trend analysis is that moving average market timing buy signals forgo early price movement in order to definitively categorize a new price trend, and that trade exit markers provided by moving averages are well behind price action trade exits – a dual handicap that some investors would find intolerable.
However, the best way to challenge these misgivings is to produce a trading record that substantiates an ongoing trading plan employing moving average crossovers as both buy and sell signals. Long-term investment returns achieved when using the Stock Trends Bullish and Bearish Crossovers indicators (![]() and
and ![]() ) will surprise sceptics.
) will surprise sceptics.
|
The Dow Jones Industrials Bullish Crossover Portfolio trading strategy:
|
|---|
|
BUY a component stock of the Dow Jones Industrials index when:
tagged with a “Bullish Crossover” indicator
|
|
SELL a stock when:
tagged with a “Bearish Crossover” indicator
|
| Stock | Symbol | Stock | Symbol | |||
|---|---|---|---|---|---|---|
| 1 | ALCOA INC | AA | 16 | JP MORGAN CHASE CO | JPM | |
| 2 | AMERICAN EXPRESS INC | AXP | 17 | KRAFT FOODS INC | KFT | |
| 3 | BOEING CO | BA | 18 | COCA-COLA CO THE | KO | |
| 4 | BANK OF AMERICA | BAC | 19 | MCDONALDS CORP | MCD | |
| 5 | CATERPILLAR INC | CAT | 20 | 3M COMPANY | MMM | |
| 6 | CISCO SYSTEMS | CSCO | 21 | MERCK CO INC | MRK | |
| 7 | CHEVRON CORP | CVX | 22 | MICROSOFT CORP | MSFT | |
| 8 | DU PONT E I DE NEMOURS | DD | 23 | PFIZER INC | PFE | |
| 9 | WALT DISNEY CO | DIS | 24 | PROCTER GAMBLE CO | PG | |
| 10 | GENERAL ELECTRIC CO | GE | 25 | AT&T INC. | T | |
| 11 | HOME DEPOT INC | HD | 26 | TRAVELERS CO | TRV | |
| 12 | HEWLETT PACKARD CO | HPQ | 27 | UNITED TECHNOLOGIES | UTX | |
| 13 | INTL BUSINESS MACHINES | IBM | 28 | VERIZON COMMUNICATIONS | VZ | |
| 14 | INTEL CORP | INTC | 29 | WAL-MART STORES INC | WMT | |
| 15 | JOHNSON & JOHNSON | JNJ | 30 | EXXON MOBIL CORP | XOM |
An example of this trading strategy at work
|
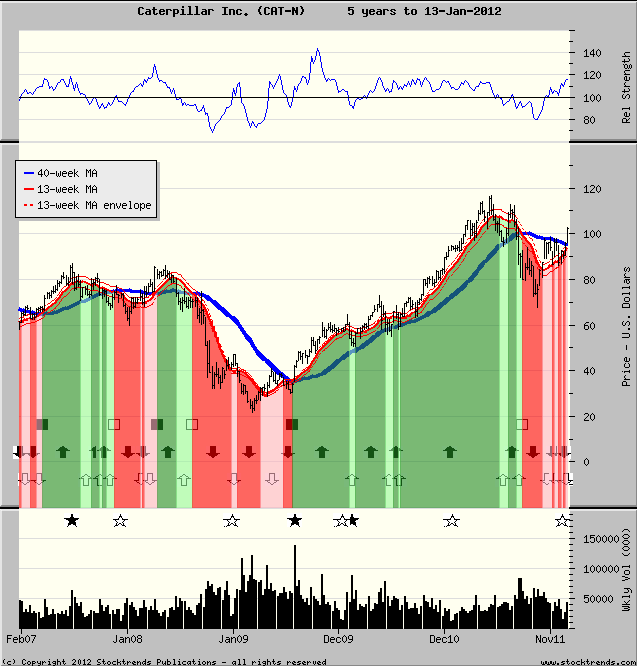
The following Stock Trends chart shows the changing trend indicators over the 5-year period from early 2007 for Caterpillar Inc. (CAT-N). It depicts three Stock Trends Bullish trend categories - all introduced by a Bullish Crossover indicator ( |
|
|
The money management rules for the portfolio are as follows:
Exposure on each position is limited to $10,000. Although the average number of positions held since 1981 is 17, the strategy could potentially require holdings of all 30 stocks at one time. Conversely, the system will not hold many stocks at all in bearish markets. During bear markets of this trading record, the portfolio holdings fell to an average of 5 or 6, while the most active year (1997) the average number of stock held by the portfolio was 26.
Transaction costs are factored into the cost of purchases and the net proceeds of sales at 1% in and 1% out, or 2% commission on a round trip.
| % Returns | |||||
|---|---|---|---|---|---|
| Year |
Average Invested Capital |
Net Gain/(Loss) |
ST Portfolio* |
S&P 500 Index |
Difference |
| Since inception 31.1 years Jan 1/1981 to Dec 31/ 2011 |
$ 171,916 | $ 844,890 | +15.9% p.a. |
+7.4% p.a. |
+8.5% p.a. |
| 2011 | 191,509 | -16,287 | -8.5 | 0.0 | -8.5 |
| 2010 | 205,283 | 11,673 | 5.7 | 12.8 | -7.1 |
| 2009 | 134,340 | 59,490 | 45.4 | 29.1 | 16.3 |
| 2008 | 67,547 | -40,835 | -59.3 | -41.0 | -18.3 |
| 2007 | 230,189 | 28,957 | 12.5 | 4.2 | 8.3 |
| 2006 | 203,585 | 23,574 | 11.7 | 13.6 | -1.9 |
| 2005 | 156,038 | -11,506 | -7.4 | 3.0 | -10.4 |
| 2004 | 199,811 | 3,099 | 1.6 | 10.4 | -8.8 |
| 2003 | 185,283 | 41,862 | 22.7 | 25.2 | -2.5 |
| 2002 | 95,660 | -34,992 | -36.3 | -24.6 | -11.7 |
| 2001 | 107,925 | -36,875 | -34.1 | -12.1 | -22.0 |
| 2000 | 129,245 | -75,064 | -58.1 | -10.1 | -48.0 |
| 1999 | 216,226 | 140,505 | 64.5 | 19.5 | 45.0 |
| 1998 | 195,283 | 115,399 | 59.1 | 31.0 | 28.1 |
| 1997 | 257,925 | 88,549 | 34.2 | 23.7 | 10.5 |
| 1996 | 239,245 | 103,473 | 43.4 | 22.9 | 20.5 |
| 1995 | 243,019 | 107,789 | 44.3 | 34.1 | 10.2 |
| 1994 | 159,057 | -147 | -0.1 | -1.5 | 1.4 |
| 1993 | 166,981 | 5,114 | 3.1 | 7.1 | -4.0 |
| 1992 | 183,396 | 9,184 | 5.0 | 8.2 | -3.2 |
| 1991 | 186,415 | 71,615 | 38.2 | 23.7 | 14.5 |
| 1990 | 153,019 | -2,212 | -1.4 | -7.0 | 5.6 |
| 1989 | 238,868 | 101,415 | 42.4 | 27.3 | 15.1 |
| 1988 | 120,755 | -3,917 | -3.3 | 12.4 | -15.7 |
| 1987 | 200,377 | -5,475 | -2.7 | 2.1 | -4.8 |
| 1986 | 199,245 | 62,940 | 31.4 | 17.8 | 13.6 |
| 1985 | 180,755 | 44,764 | 24.9 | 26.1 | -1.2 |
| 1984 | 102,264 | -29,285 | -29.0 | 0.8 | -29.8 |
| 1983 | 191,132 | 47,492 | 24.7 | 17.3 | 7.4 |
| 1982 | 133,962 | 48,723 | 36.8 | 14.8 | 22.0 |
| 1981 | 53,585 | -4,535 | -8.5 | -10.1 | 1.6 |
* ST portfolio annual returns are based on average invested capital for the year.
Tough times in the new millennium
| % Returns | |||||
|---|---|---|---|---|---|
| Year | 1-year | 2-year | 3-year | 5-year | 10-year |
| Dec 31, 2011 | -8.5 | -1.2 | 9.6 | 4.9 | 3.7 |
| Dec 31, 2009 | 40.8 | 12.8 | 10.4 | 7.8 | -2.6 |
| Dec 31, 1999 | 64.5 | 57.7 | 51.7 | 48.1 | 32.3 |
* ST portfolio annual returns are based on average invested capital for the year.
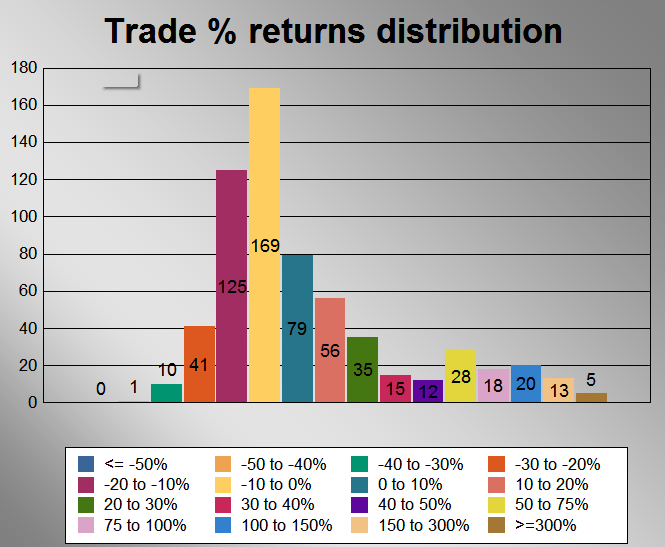
Returns on invested capital are a good measure of long-term performance of a trading strategy, but the statistics revealed by the trade history are a good metric of how those results were achieved. The distribution of returns of the 620 positions closed before December 31, 2011 shows that the majority of trades returned between -20% and +10%. Profitable trades were 42% of all positions - below 50%, but typical of many successful market timing trading systems. The trading system's Profit Factor of 3.1, though, reveals the strength of the trading strategy. It measures the the relative $ gains of winning trades versus the relative $ losses of losing trades. Average gains per winning position are over three times higher than the average losses per losing trades. This characteristic allows the system to generate positive returns over the long-term, even though most trades are losing trades. Because expectations of high probablity trading (expecting that a trade signal will ALWAYS be right) should always be tempered by actual results, active traders must always seek to achieve a trading record with a relatively high Profit Factor. This trading strategy scores well on that measure.
|
Trading Statistics |
|
|---|---|
| Total # of (completed) positions taken: | 620 |
| # of winning positions (winning %): | 359 (42.1%) |
| Average gain(%) per winning position: | 48% |
| Average loss(%) per losing position: | 11% |
| Profit factor**: | 3.1 |
| Maximum gain(%) on a position: | 570% |
| Maximum loss(%): | -45% |
| Annualized return on average invested capital: | 15.8% |
| Average invested capital: | $171,916 |
| Average # of positions held: | 17 |
| Average # of weeks invested in each position: | 44 |
|
* all trading stats compiled at December 31, 2011 on closed positions **Profit Factor = (% of winning trades X average $ gains on winning trades) / ABSOLUTE VALUE[(% of losing trades X average $ losses on losing trades)] |
|

