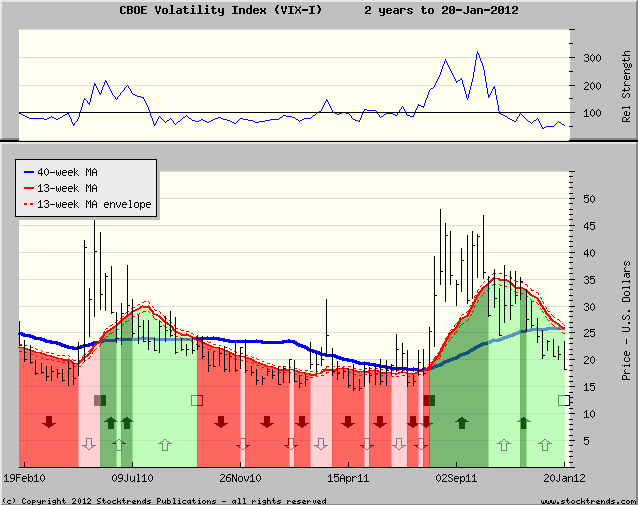
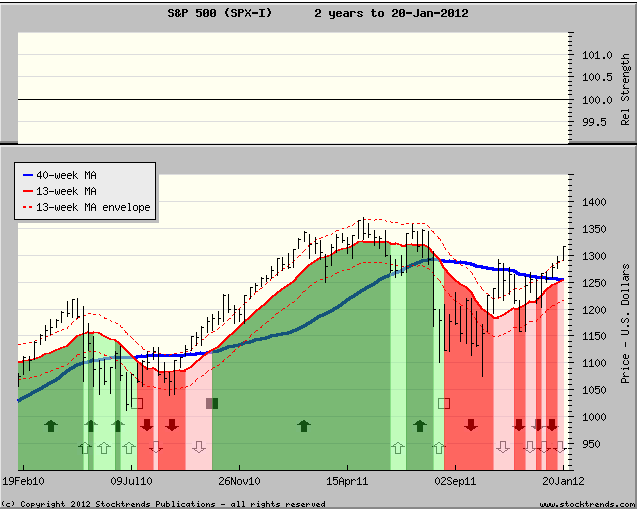
Expectations of market volatility have dropped. The Volatility Index is Stock Trends Bearish; the S&P 500 index is about to turn Stock Trends Bullish. Is this a good time to be in equities?
January’s market advance has offered a fresh hope for equity investors. The S&P 500 is up almost 5% in 2012, while the S&P/TSX Composite has advanced 4%. Another sign that perhaps signals a launch for markets ahead is shrinking market volatility. The CBOE Volatility Index (VIX) has dropped steadily from its peak in the autumn last year, and is now a Stock Trends Bearish Crossover ![]() . With the S&P 500 index now verging on a Bullish Crossover
. With the S&P 500 index now verging on a Bullish Crossover ![]() , this inverse relationship between market advances and dropping price volatility expectations may be a supporting signal of continued bullish trending for stocks.
, this inverse relationship between market advances and dropping price volatility expectations may be a supporting signal of continued bullish trending for stocks.
Inverse correlation of trend between the CBOE Volatility Index (VIX) and S&P 500 Index


Performance of the S&P 500 index
during a VIX Stock Trends Bearish trend
| Date |
VIX ST Trend |
VIX Price |
S&P 500 ST Trend |
S&P 500 Price |
S&P 500 % Chg |
|---|---|---|---|---|---|
| 10/11/96 | 15.51 | 700.66 | |||
| 12/13/96 | 22.26 | 728.64 | 4% | ||
| 2/20/98 | 19.55 | 1034.21 | |||
| 8/21/98 | 31.91 | 1081.18 | 5% | ||
| 1/08/99 | 23.88 | 1275.09 | |||
| 2/18/00 | 28.45 | 1346.09 | 6% | ||
| 8/04/00 | 21.54 | 1462.93 | |||
| 11/24/00 | 29.58 | 1341.77 | -8% | ||
| 6/15/01 | 26.33 | 1214.36 | |||
| 9/28/01 | 35.19 | 1040.94 | -14% | ||
| 1/04/02 | 22.02 | 1172.51 | |||
| 7/12/02 | 38.33 | 921.39 | -21% | ||
| 1/10/03 | 27.13 | 927.57 | |||
| 5/13/05 | 16.32 | 1154.05 | 24% | ||
| 7/15/05 | 10.33 | 1227.92 | |||
| 10/21/05 | 16.13 | 1179.59 | -4% | ||
| 12/02/05 | 11.01 | 1265.08 | |||
| 5/26/06 | 14.26 | 1280.16 | 1% | ||
| 10/13/06 | 10.75 | 1365.62 | |||
| 3/30/07 | 14.64 | 1420.86 | 4% | ||
| 5/16/08 | 16.47 | 1425.35 | |||
| 9/19/08 | 32.07 | 1255.08 | -12% | ||
| 4/17/09 | 33.94 | 869.6 | |||
| 5/28/10 | 32.07 | 1089.41 | 25% | ||
| 10/01/10 | 22.5 | 1146.24 | |||
| 7/29/11 | 25.25 | 1292.28 | 13% | ||
| 1/20/12 | 18.28 | 1315.38 |