|
Emerging market stocks are earning back investor confidence. When the 'risk-on' button has been pushed market-timing traders are prepared to rotate into foreign equities at the earliest sign of sustained price momentum. Considering the muted volatility of the broad North American stock market, evidence of a blooming sector rotation to overseas equity risk is a welcome technical signal for investors.
In U.S. dollar terms, Brazilian equities are outperforming U.S. equities by 13 per cent since the end of January. Southeast Asian markets - Indonesia, Thailand, and Philippines in particular - are also setting a much better pace than U.S. stocks. These markets are currently labeled as Stock Trends Weak Bearish ( ) - indicating that the primary long-term bearish trend category is shifting - or have recently had a Bullish Crossover ( ) - indicating that the primary long-term bearish trend category is shifting - or have recently had a Bullish Crossover ( ) and changed to a Stock Trends Bullish ( ) and changed to a Stock Trends Bullish ( ) trend. Many have rallied nicely in the past month. It's not surprising to see a surge in the number of stock picks that fit the emerging market theme. ) trend. Many have rallied nicely in the past month. It's not surprising to see a surge in the number of stock picks that fit the emerging market theme.
The most recent Stock Trends Picks of the Week report features over twenty emerging market stocks and ETFs. Bank, communications, utilities, and energy stocks lead this group.
Emerging market stocks and ETFs on the move
The Relative Strength Indicator (RSI) provides a measure of the strength of a stock’s 13-week price movement relative to the S&P 500 index. Stocks outperforming the index have an RSI value above 100.
But should investors be jumping on these stocks now? Timing is everything for active traders, but is now the time for investors with a longer trade horizon? For the technician evaluating a multi-year chart of the iShares MSCI Emerging Markets ETF (EEM-N), for instance, the answer to the question would come from further price development above a long-term price formation that indicates consolidation. Even the impressive spring rally that has propelled Brazilian stocks is not convincing enough when measured against the backdrop of a bearish long-term trend. How can we know if the rewards will match the risk inherent in these markets?
Stock Trends indicators report on price trends, but they also give guidance on what kind of future returns those trend categories imply. Sampling indicator combinations like the ones currently sported by these emerging market issues and statistically measuring post-observation returns gives us a more quantitative interpretation of this group of performing stocks and ETFs.
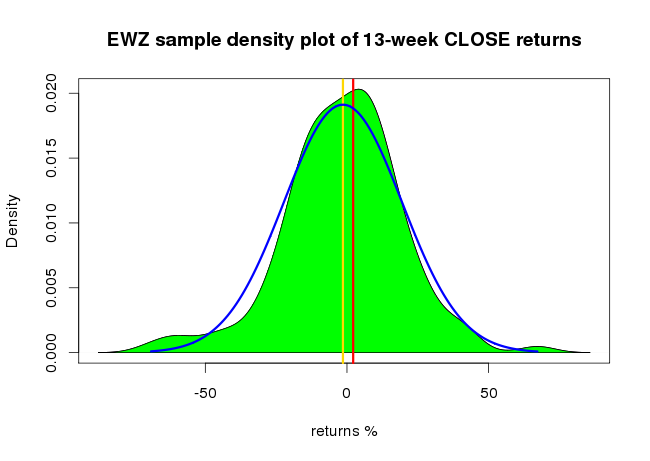
For example, the sample of 145 stocks that have had similar Stock Trends indicator combination and trend longevity as the iShares MSCI Brazil Capped ETF (EWZ-N) gives us an expected return below the expected market return for the coming 4-week, 13-week and 40-week time periods. The graph below shows the distribution of 13-week returns of the sample and the assumed normal distribution of the population of stocks with similar Stock Trends indicators.

The sample density distribution is filled in green. The assumed population distribution - a normal distribution - is outlined in blue. The vertical yellow line indicates the estimated population mean return. The vertical red line indicates the base return of a randomly selected stock.
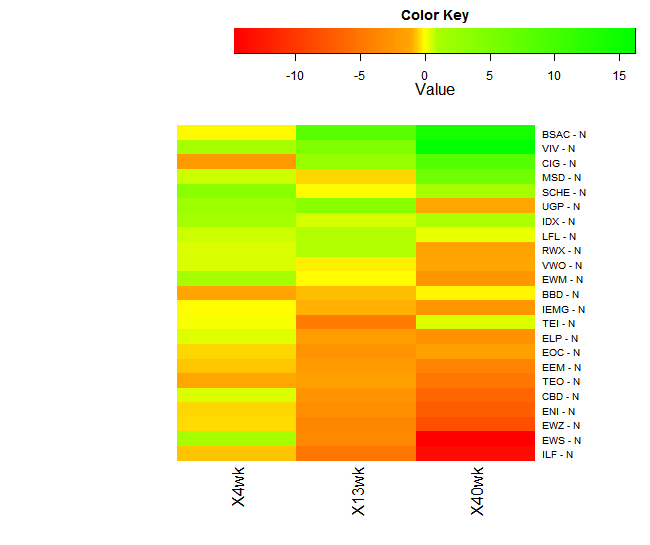
The following heatmap graph ranks some of the issues highlighted here by estimated returns implied in the market conditions categorized by the Stock Trends indicators. The estimated returns (%) of 4-week, 13-week, and 40-week periods are discounted by the base period expected market returns. The green elements of the map represent progressively higher performance expectations. Yellow elements represent market performance, while red elements represent progressively lower performance expectations.
Ranking of returns expectations: 4-week, 13-week, 40-week

What does this tell us? The statistical inference analysis doesn't give the investor much confidence about returns over the next three quarters for many of these issues. This is not to say that these emerging market issues are not now in nascent stages of bullish trends, but the markers of more promising return expectations in the immediate future are not yet in place. For more conservative investors there is no need to jump on these risky markets yet.
|


