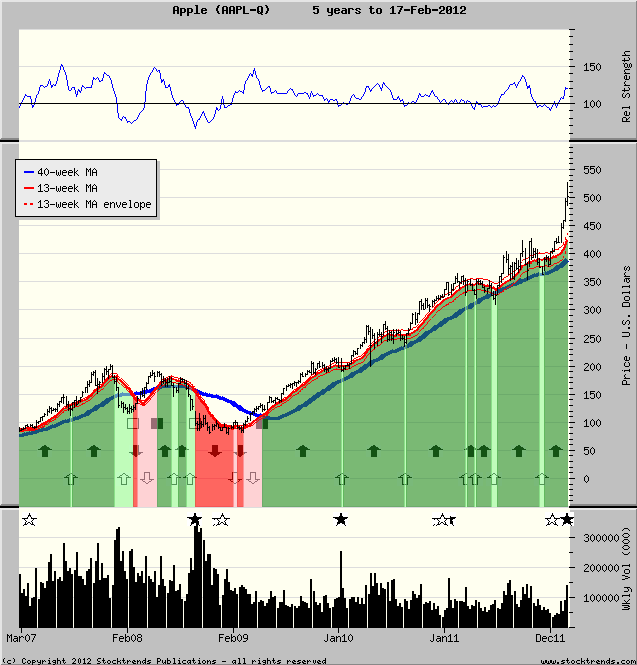
Shares of Apple Inc. continue to defy gravity. Although most shareholders remain convinced that the company will continue to deliver higher valuations, some might be wondering if the stock's price momentum is due to dwindle. Judging by past periods of market out-performance nervous Nellies should not be worried yet.
|
If there is a market darling, surely the stock of Apple Inc. (AAPL) is it. Even in the midst of great market uncertainty concerning the global economic picture, Apple’s shareholders seem to be above it all. Its valuation is consistently supported by ever growing revenues and profits. That this tech juggernaut is now the largest company by market capitalization is not even surprising– surpassing in recent weeks the mighty Exxon Mobil (XOM). But when does this blessed investment start to disappoint?

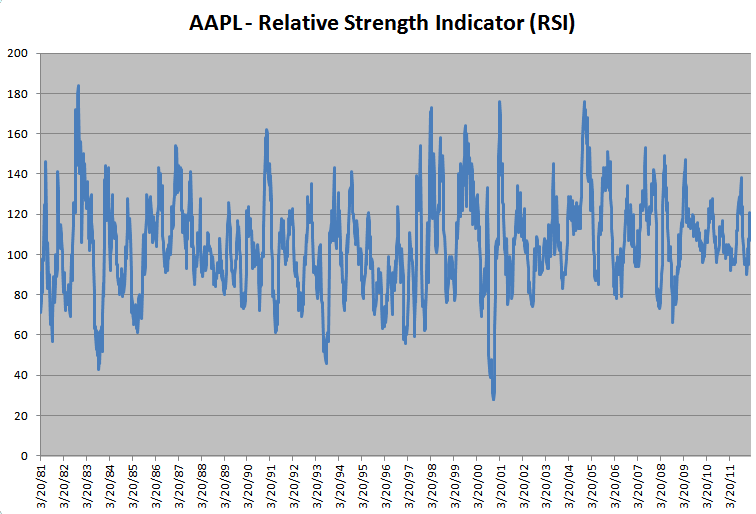
For AAPL, disappointment might only mean a slip in market outperformance. Stock Trends users know that the comparative Relative Strength indicator (RSI) quickly tells us how a stock is doing relative to the market. Currently AAPL has an RSI of 120, which means the stock has outperformed the S&P 500 index over the past 13-weeks by about 20%.
If that seems a bit overextended, keep in mind that the stock has an impressive record as a momentum stock and that the current RSI is still less than one standard deviation (STD) away from its average RSI (121) during periods when shares have outperformed the market. A standard deviation is a measure of variability, so a higher variability of the Relative Strength indicator shows a stock has a tendency to deviate beyond the overall market movements. One standard deviation away from AAPL's average positive RSI (121) would put the indicator at 136. In fact, AAPL has outperformed the market beyond its present margin for 22% of the time during the past three decades.
There have been several periods that AAPL’s RSI has topped two standard deviations (positive deviations), and this remains a momentum stock even as it tops all in market cap. By comparison to AAPL’s Relative Strength standard deviation of 16, the Relative Strength standard deviations (during periods these stocks have outperformed the broad market in the last 30-years) of comparable big cap tech stocks Microsoft MSFT (13), IBM (8), Intel INTC (13), Cisco Systems CSCO (15) as well as blue chips in other sectors like Caterpillar CAT (8), Exxon Mobil XOM (6), and General Electric GE (5). The company's growth in the past five years has not diminished the price momentum of its shares: AAPL's 5-year standard deviation in periods of market outperformance is 12, compared to MSFT (7), IBM (7) and CSCO (6). In short, Apple's stock has a strong tendency toward extending its price momentum compared to other blue chip tech stocks.
 With Apple’s shares trading above $500 after pulling back from their all-time high, investors worried about price momentum fatigue should yield again to its incredible history of defying gravity. The current Stock Trends Bullish trend has been running strong for 145 weeks and appears destined to challenge its longest Bullish trend to date – when the stock powered from the $9 level in the spring of 2003 to above $70 in the summer of 2006. That 678% gain would be hard to duplicate now, but the 311% gain in Apples’s shares since it turned Stock Trends Bullish in May of 2009 is surely not the end of this haul.
|